This white paper aims to unpick some of the deeper issues surrounding bed block and emergency department crowding from the perspective of a frontline medic with two decades of emergency and flow management experience. It aims to provide a greater understanding of the factors influencing the current situation and the measures used to define it followed by some practical implementable solutions.
Introduction
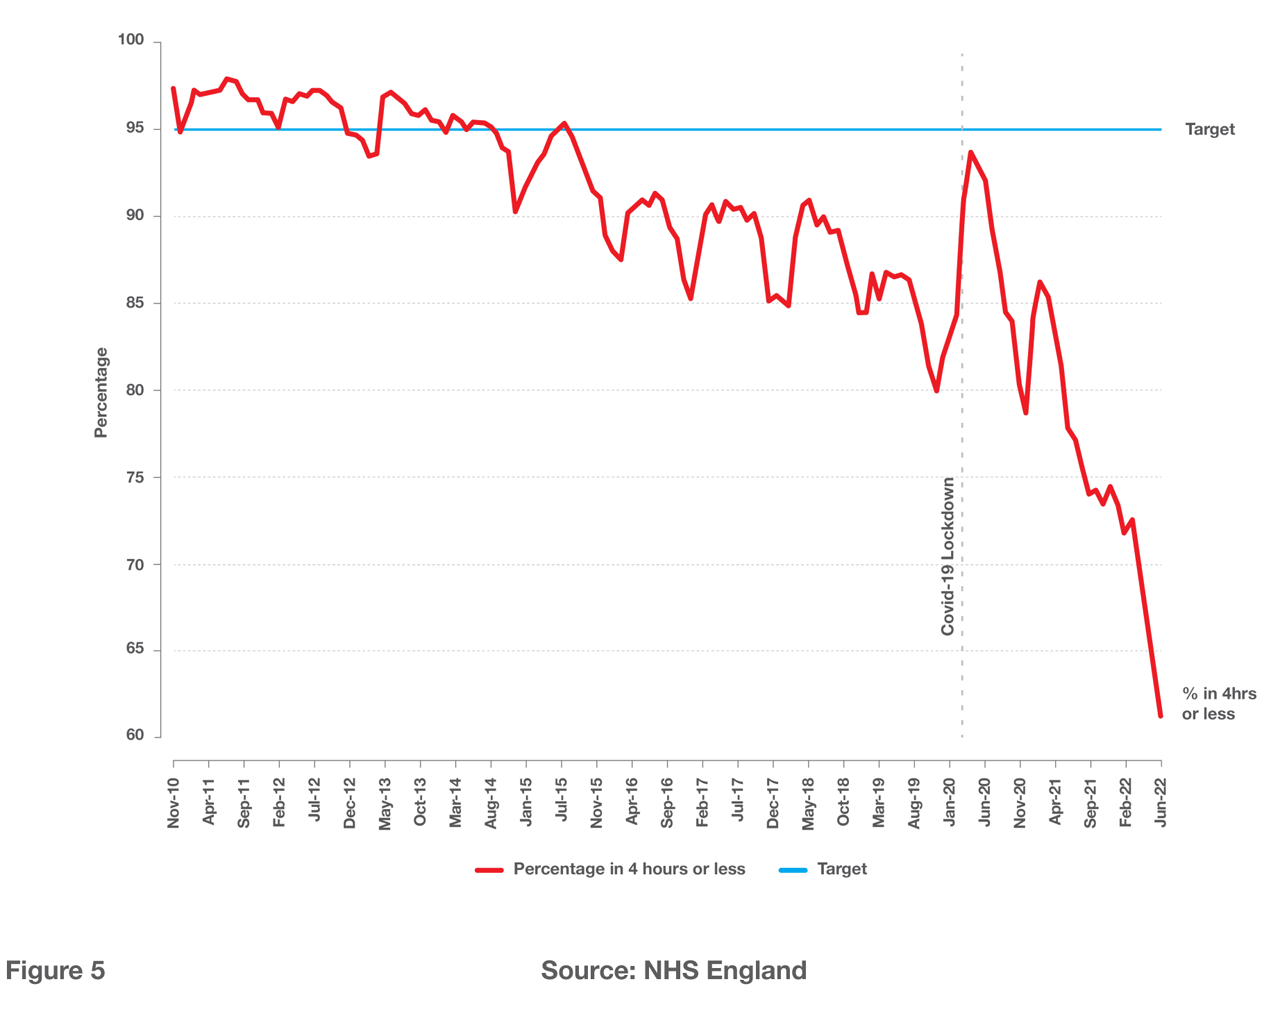
Emergency departments in the UK have experienced a substantial increase in the number of attendances. From March 2011 to March 2022 there has been a 16% increase in attendances (see Figure 1). Over the same time, hospitals have dramatically reduced their bed base and hospital occupancy rates are routinely above 92%. As a result, the 4-hour 95% emergency care standard dropped to 62% in June 2022.
Pressures throughout the NHS and social care system are contributing to Bed Block and ED crowding. Patient outcomes as well as staff experience and retention are being negatively affected with some staff leaving the NHS and others opting for less than full-time work.
With data readily available at every point of the patient journey, organisations can now generate operational reports at a more granular and meaningful level. This knowledge can help organisations proactively manage risk throughout the system prior to events unfolding and create safer environments for patients and better working conditions for staff. It can also provide stakeholders and commissioners with a better understanding of where improvement opportunities lie and where to direct limited resources.

Meaningful Data
Consumers of frontline health care in the UK are experiencing long delays in obtaining a hospital bed. The optimal 85% hospital occupancy rate[1] is being surpassed regularly[2] with hospitals routinely operating over 92% occupancy. Many hospitals include “ring-fenced” elective beds in those figures[10]. In practice, this means that general and acute beds are unavailable for new admissions for prolonged periods of the day. This is what many refer to as “bed block”.
This capacity-demand mismatch is most obvious in the early mornings when the emergency department (ED) has “boarded” numerous patients overnight waiting To Come In (TCI) to the hospital. A typical admitted patient pathway would include; arrival to ED (ambulance or walk-in), registration, triage, investigations, consultation, admission. The current measure used to capture this metric is called the Decision To Admit (DTA) to Admission Time. Figure 2 (green line) shows DTA cumulative data from a typical large teaching hospital, with a peak overnight.

Emergency departments routinely start the day with multiple pending DTAs and as the morning progresses ED attendances rise sharply (see Figure 2, Red line). Hourly attendances peak around 10 a.m. and remain elevated late into the evening adding to the number of bed requests (see Figure 2, Orange line) and the overall volume of patients in the ED.
It is at the point of excess DTAs and sustained new attendances that the ED can run out of room to see the new arrivals. This is what is referred to as ED crowding. When hospital occupancy rates are high the only solution for patients requiring admission is for patients on wards to be discharged from the hospital. Hospital discharge rates rise slowly during the day and peak around six o’clock (see Figure 2, blue line). This is why EDs are crowded throughout the day and if the admission rate exceeds the discharge rate the ED is stuffed, quite literally.
A good measure of ED crowding and bed block is the ambulance handover time. The NHS standard contract states that Ambulance to ED handovers must take place within 15 minutes with no handover taking more than thirty minutes[3]. Any handover over sixty minutes is referred to as a ‘black breach’ and is a never event for hospitals. During the winter of 2021-22, only half of all ambulance to ED handovers met the standard[4]. More precisely, in the week 14-20 February 2022, there were 84,584 ambulance arrivals to EDs. Of those 17,778 handovers were over 30 minutes (21%) and 7,192 (8.2%) were over sixty minutes[5]. A comparison of the black breaches over the last three years demonstrates the state of ED crowding (see Figure 3).

To shorten ambulance handover times and combat ED crowding, hospitals have introduced initiatives like self-handover (patients brought by ambulance but are able to walk to reception and register themselves), fit-to-sit (patient brought by ambulance who can sit together on chairs in the ambulance receiving area), sub-wait areas (an area to cohort patients who do not require a cubicle) and co-located minor ailment services (in-house Primary Care and minor injury services). These initiatives all help to maximise the ED footprint and can assist in achieving some ED performance standards but ultimately, they all contribute to further ED crowding.
Another measure, the national 12-hour trolley standard (DTA over 12 hours) is being breached regularly [6]. Some hospitals have reported DTA waits of up to 48 hours yet this metric does little in defining the actual time that patients are waiting in EDs.
From a reporting perspective, the time of DTA is defined as the time when a clinician decides and records a DTA the patient or the time when treatment that must be carried out in ED before admission is complete – whichever is the latter. This caveat “must be carried out in the ED” has translated into a multitude of additional internal processes or reasons why the patient is not ready to transfer and each event resets the clock. So, a patient could be in the ED for 48 hours and still not breach the 12-hour trolley standard because they needed the third dose of antibiotics, required a speciality review or maybe the receiving team has ordered a scan in an attempt to exclude/determine their involvement. Or perhaps a doctor simply forgot to write that they don’t think the patient has Covid in the notes.
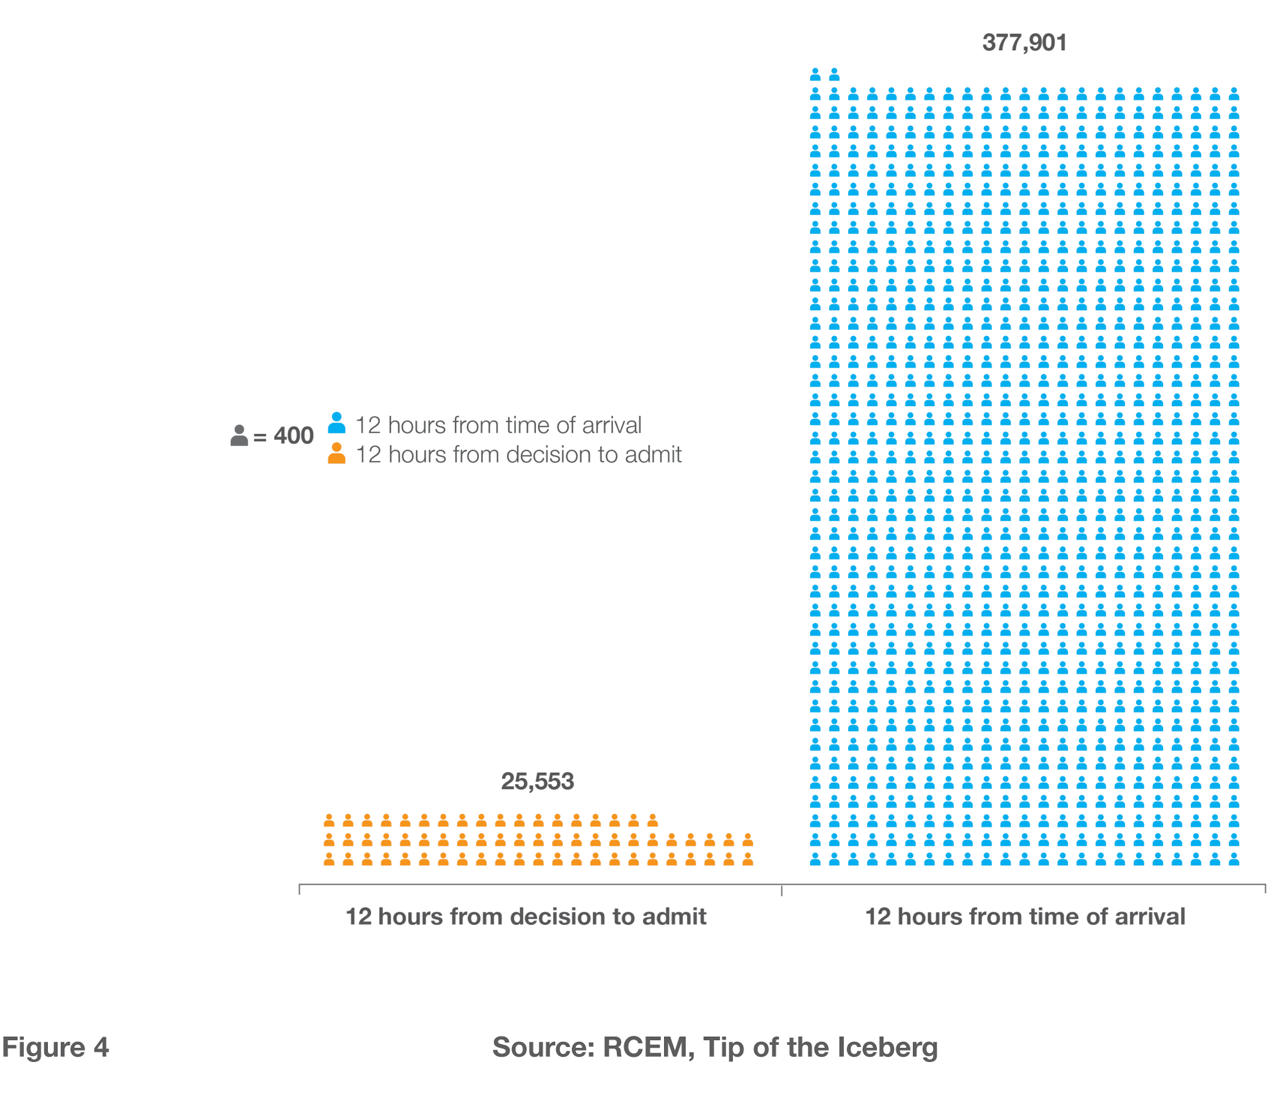
Whatever the reasons, the 12-hour trolley standard masks the real issue which is the actual time that patients are staying in EDs. It would be more meaningful from a patient and reporting perspective to concentrate on the Time Of Arrival (TOA). This graph from the Royal College of Emergency Medicine (RCEM), Tip of The Iceberg, June 2022[7] illustrates the stark contrast between the two measures (See Figure 4).
There have been discussion and trials of new ED standards including mean-time in the ED for admitted and non-admitted patients. These initiatives appear to have stalled in the current climate. A clinically led review of the new standards in 2021 called for a phased implementation, a focus on restoring routine NHS services and better data analysis systems[8].
The NHS constitutional pledge of the 95% 4-hour target is currently rarely discussed. Not one organisation has managed to achieve it this year, with the UK average in June 2022 at an all-time low of 62% (see figure 5)[9].
Although the 4-hour standard is measured in the ED, the majority of factors influencing it are outside the abilities of the ED to solve. It is however a good barometer for overall NHS and social care performance[10] but its ability to define where the problems lie is limited because the breach validation process is lacking in science and meaning. What does the breach classification ‘Wait for Doctor’ actually mean anyway? Is it that EDs are not working hard enough (historical jargon), a workforce issue, capacity issues or pressures elsewhere in the system? Nobody knows because those metrics are not being captured in a meaningful way or in conjunction with the 4-hour standard.
There is an urgent need for a system-wide combined data analysis solution that includes relevant key performance indicators with meaningful baselines, actionable data outputs and clear expectations.
Bed Availability and Staffing Constraints
The relationship between ED crowding and poor patient outcomes has been extensively researched over the last decade[11,12,13]. We know that ED crowding results in an increase in mortality, length of stay and medical error. It also contributes to poor staff experience and retention. The Royal College of Emergency Medicine outlines two main solutions to combat ED crowding: more ED consultant equivalents (nationally 2,250) and more beds (4,500 before winter 2022 and another 8,500 over the next 5 years)[7].
Emergency medicine is currently a competitive speciality. Trainees enjoy the supervised autonomy inherent to working in EDs, and trainees who learn to safety net, manage risk and make decisions quickly thrive in this environment. However, most training doctors now work Less Than Full Time (LTFT). So perhaps the actual number of additional consultant equivalents required is closer to 3,600 factoring in for the LTFT work-life balance that most trainees have embraced[14].
This LTFT working represents a step-change in workforce behaviours and availability and has been fuelled by workplace factors like stress, burnout, moral distress from unsafe workloads[15] and financial factors including the new doctor’s contract and tax disincentives on additional income and pension contributions[16].
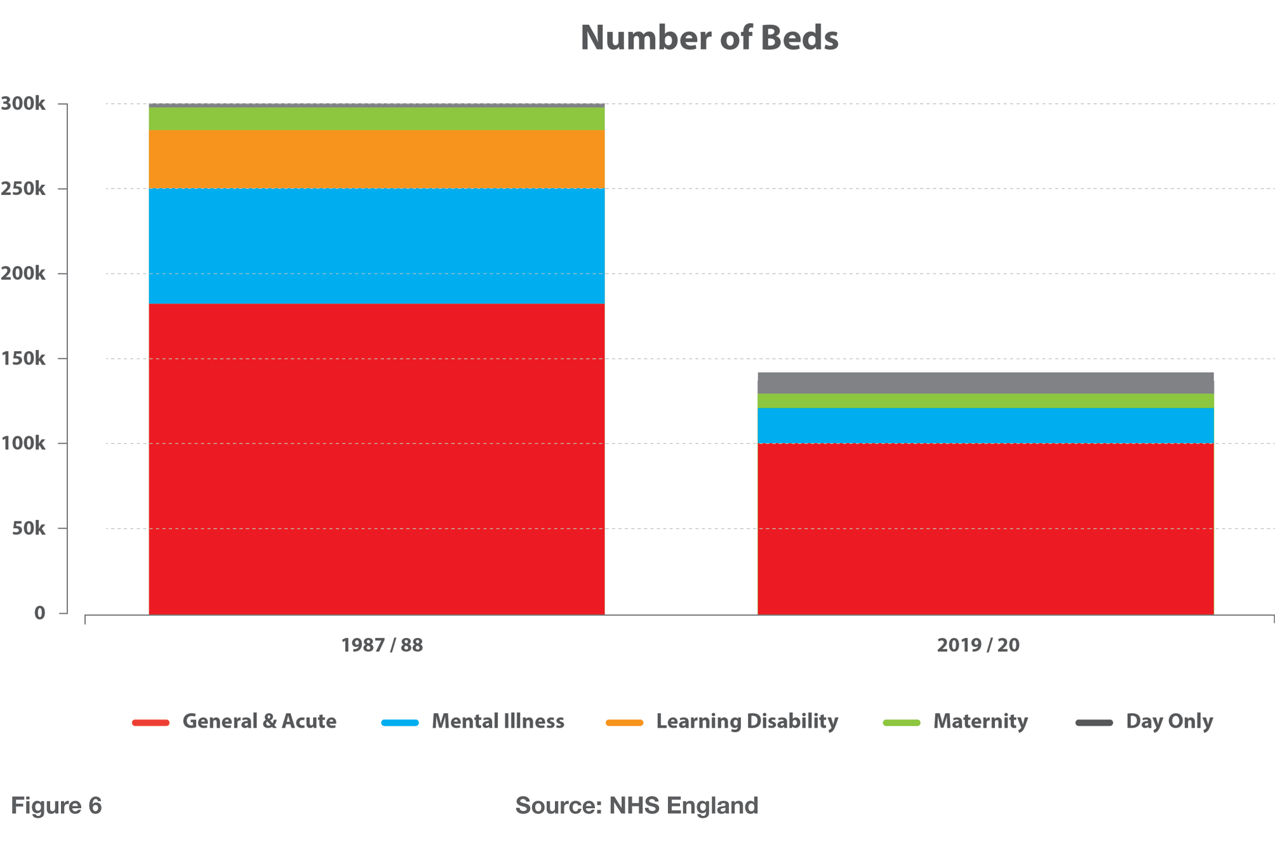
As for the beds, there has been a 53% reduction in national bed stock over the last 3 decades[17] (see Figure 6). Some of this has come about naturally from medical advancements in day case surgery, medical day case units, virtual services and care in the community. In other cases, wards have been actively closed to support austerity measures to meet annual 5% Cost Improvement Programmes over the last decade[18]. Closing a ward saves about £1 million annually so it is not surprising that this option is near the top of every hospital’s agenda.
More recently and worryingly wards or sections of wards have been closed due to the lack of nurse staffing. The government’s manifesto commitment of 50,000 new nurses by 2024/25 is welcome. However, it is the retention of the current and newly qualified staff that is an important issue with 27,133 nurses and midwives having left the profession in 2021 according to the Nursing and Midwife Council (NMC)[19]. Stress, negative culture, poor quality of care, Covid, retirement and better life options were identified as key factors for staff quitting in a follow-up NMC survey[20]. The Royal College of Nursing highlights the importance of a culture that promotes learning and the ability of nurses to raise and escalate concerns[21].
Covid continues to impact bed availability. Wards that would have previously been used as escalation or winter wards are still being used as Covid wards. According to NHS England’s daily Covid-19 situation report (07/07/2022), there are 11,878 beds (approx. 475 wards) occupied by Covid patients[22]. Moreover, managing the Covid ‘pop-ups’ (patients with incidental Covid) and the isolation of those patients and their contacts is further reducing bed availability and keeping Infection Prevention and Control and site operational teams very busy. Covid also continues to contribute to excessive levels of staff sickness.
Emergency departments often point their fingers at site teams for the lack of beds but from an operational perspective, the site team is at the mercy of admission and discharge rates. They can only create capacity by moving patients from assessment units to downstream wards. When options are limited, when every bed must be considered, they will sometimes move patients between specialities or even services. Unfortunately, this results in an increase in speciality outliers, safari ward rounds, and suboptimal care by teams who are less familiar with managing non-speciality patients and it can impact on elective pathways. Additionally, every patient move between wards will increase their overall length of stay in the hospital.
One simple thing that operational teams could do is to provide better visibility and clarity on the current organisational position and decision-making by publishing all operational reports to an open forum that is accessible to all staff members.
System Factors Influencing Emergency Department Crowding
Currently, there are fewer General Practitioners (GP) than there were in 2015 and the number of patients per GP has increased by 16%[24]. This results in an increase in ED foot traffic by patients who find it difficult to get a GP appointment or who are dissatisfied with their telephone consultation and perhaps more soft referrals by overstretched GPs. However, the lack or availability of Primary Care is not wholly to blame for the additional ED attendances. ED attendances have only slightly increased compared to pre-Covid levels (0.8% increase from May 2019). Most of these appear to be minor ailments or injuries as admission rates have fallen to 26.3% from 29.7% in May 2019[23]. In reality, GPs are offering more appointments than ever and two-thirds of those are face-to-face [25].
There are numerous other factors and sources of ED attendances that are driving ED crowding and bed block other than primary care. For this paper they have been limited to five additional causes:
- Social and cultural beliefs about health and when and how to access care – Social norms regarding health have changed over the last decade[26,28]. Now it is common that every child with a flu-like illness, a bang to the head or a scraped knee will be taken to a medical professional for sign-off and parental reassurance. In other cases, patients attend more than once with the same condition anxious about their progress doubling or tripling the workload. The ongoing pandemic, mainstream and social media hype surrounding medical conditions generally are fuelling population anxiety[26] and health anxiety is the third most common form of anxiety[27]. Parents with children and the younger population in particular are attending EDs more often[28] and lack the knowledge and or confidence to manage even the most basic of self-limiting conditions without requiring a medical professional’s opinion.
- Lack of speciality assessment units – In some respects, due to the success of emergency medicine i.e., the ability to get investigation results quickly, hospital specialities have moved their assessment units into EDs. What this means is that patients who have already been assessed by an allied health professional in the community and are deemed to require speciality input are being directed to EDs. Hospitals that have robust direct admission pathways to assessment units including Same Day Emergency Care (SDEC) services will benefit as 80% of patients seen in SDEC have a zero length of stay (LOS) while admissions from the ED have on average a 4.2-day LOS[23].
- NHS 111 ED recommendations – NHS 111 is a growing high-volume service. In the month of March 2022, it received 1,818,579 calls. Of the callers who persisted through the 111 triage process (16.8% did not), 11.2% were referred to an ambulance service and 12.3% were recommended to attend an ED[29]. In addition, there are the patients who were dissatisfied with 111 telephone advice or were told by 111 to attend the ED if their condition deteriorates. All groups considered, the actual number of 111 calls that potentially result in an ED attendance could be as high as 40.3% or higher. Currently, 111 patient outcome datasets are not shared directly with EDs.
- Mental Health Services – 4.3 million people were referred to mental health services last year creating a backlog of 1.4 million people still waiting to start treatment[30]. In the under-18s there has been a 52% increase in referrals over the last two years and a reduction of 20% paediatric mental health beds over the last five years[30]. The lack of mental health (MH) facilities including section 136 suites means that people are directed to EDs as they have been deemed to be ‘a place of safety’. EDs are poor environments for patients with MH needs because they are crowded, noisy, confusing and chaotic. Even when prioritised MH patients can experience long delays particularly if a mental health act assessment is required (21,282 people last year[31]). Furthermore, people requiring detainment in an MH hospital (16,117 people last year[31]) experience extensive delays as MH teams search nationally for a suitable bed.
- NHS Backlog – Most of us have heard about the consultant-led elective care post-pandemic backlog. What is often forgotten is the growing pre-pandemic backlog of 4.5 million people (see Figure 7). The current backlog without the pandemic would have been approximately 5 million people as of April 2022 (see Figure 6, black line). Meaning that the pandemic resulted in an additional 1.5 million people with an overall total of 6.5 million people[32].
Backlog recovery plans are being hampered by the continued impact of Covid[22], NHS sickness rates twice that of the public sector[33] and high hospital bed occupancy rates[2]. Despite modest improvements in 2021, the number of electives and outpatient attendances currently being carried out is still well below pre-pandemic levels. Between April 2020-March 2022 there were 4.55 million fewer elective procedures and 30.92 million fewer outpatient attendances[32]. This lack of care in elective consultant services will drive more people to EDs seeking answers, requiring management of known conditions and ultimately more admissions when unmanaged conditions deteriorate to the point of crisis.

In summary, ED crowding and bed block are the result of extreme pressures throughout the NHS and social care system. The current measures used to define them are inadequate in identifying the risks and potential solutions in a meaningful way[8]. Perversely some metrics, notably TCI times, may be contributing to ED crowding.
With patient care and staff welfare being negatively affected it’s time for hospitals to adopt better data analysis systems[8] that are more empowering and conducive to learning[21] at all points of patient contact. To this end, frontline healthcare workers are suggesting the following set of solutions.
Solutions
Capture Meaningful Data The first step in any improvement process is to define and measure the situation. The RCEM has recommended systems that can monitor, in real time, the degree and impact of ED crowding since 2012[11]. They originally suggested three key performance indicators (KPIs) to form a type of ED situation report (SitRep), ambulance handover times, trolley occupancy rates and patients waiting for admission. Described above there are other safety and performance-altering factors worth including in any ED SitRep and many of these are available electronically. An ED SitRep fit for today could contain the following set of KPIs.

Situation reporting should not be restricted to EDs only. The same principles should be applied across all aspects of the NHS and social care services. To address factors surrounding occupancy rates and flow, hospitals should obtain a real-time understanding of what is happening at ward and unit levels. Ward KPIs should include elements of SAFER[34] and FOCUSED[35] Model principles. A meaningful ward SitRep might include the following KPIs set out in figure 9.

Services must agree and contribute to the development of each KPI and its weightings to ensure an accurate account of risk and pressure scores (OPEL scores).
New initiatives and improvement work can be included in the KPI list to allow for direct analysis and an impact assessment against other KPIs. In addition to the numerical indicators, staff should be allowed to include a narrative or description of what is happening in their areas from their own perspective. Although subjective, this will capture the other elements of safety and performance that are not readily available or suited to a digital format and it will give staff a voice.
Transactional Escalation Actions
Once an accurate description of a service is defined and agreed organisations can start to analyse and explore the mitigating actions and transactional behaviours that maintain services at optimum levels.
Escalation action cards and action trackers should be moved to a digital format to harness the power of existing technologies that can link OPEL-scored situation reports directly to action notifications.
Actions should be explicit with clear action owners and timelines. Staff should be allowed to describe what they have or haven’t done and why.
In addition, all escalations requests and outputs should be analysed for compliance and effectiveness. Systems should allow for local modifications to SitRep KPIs and their escalations so that changes can be made quickly and new initiatives explored.

Provide Visibility
It is difficult for staff on the ground and even sometimes senior managers to maintain current knowledge of site configuration, status reports and day-to-day operational decisions. This lack of knowledge can result in siloed thinking and behaviours. Hospitals can overcome this by publishing all SitReps, escalations, handovers, huddles and operational decisions to a single overarching staff inclusive platform.
Improve the Culture
Organisational culture can be improved by allowing staff to come together to discuss, document and escalate what is happening in their areas. These reports should be used to define a department’s situation centrally and should include data from both hospital’s performance indicators and other factors that are influencing care, staff wellbeing and patient safety. This approach will empower staff to work together to define the issues, develop new strategies and implement solutions that improve the overall state of their departments. It will also create an environment of openness and ownership.
The NHS needs to move away from the blame culture of excessive incident reports and root cause analysis on events that can be easily defined in a standard SitRep. Instead, organisations should identify risks proactively by capturing meaningful data that clearly defines pressures across all aspects of the system, providing staff with a safe place to communicate and discuss their concerns without fear of rejection or inappropriate blame and developing solutions that are relevant, agreeable and transactional.
Dr Bradley J Wilson
ED Consultant
Command Centre Medical Director
Co-founder of CEMBooks
Brad@CEMBooks.com
References
- National Institute for Health and Care Excellence. Chapter 39 Bed occupancy. https://www.nice.org.uk/guidance/ng94/evidence/39.bed-occupancy-pdf-172397464704
- NHS England. Bed Availability and Occupancy Data. https://www.england.nhs.uk/statistics/statistical-work-areas/bed-availability-and-occupancy/bed-data-overnight/
- NHS England. NHS Standard Contract 2021-22. https://www.england.nhs.uk/wp-content/uploads/2021/03/NHS-Standard-Contract-technical-guidance-202122-republished-October-2021.pdf
- NHS England. Urgent and Emergency Care Daily Situation Report data, https://www.england.nhs.uk/statistics/statistical-work-areas/ambulance-quality-indicators/
- NHS Confederation, What is the latest data telling us about ambulance handover delays, https://www.nhsconfed.org/articles/what-latest-data-tell-us-about-ambulance-handover-delays
- NHS England. Statistics website. A&E Attendances and Emergency Admissions, May 2022 Statistical Commentary, http://www.england.nhs.uk/statistics/statistical-work-areas/ae-waiting-times-and- activity/
- Royal College of Emergency Medicine. Tip of the Iceberg. https://rcem.ac.uk/wp-content/uploads/2022/06/Tip-of-the-Iceberg-12-Hour-Stays-in-the-Emergency-Department.pdf
- NHS England and NHS Improvement. Clinically led review of urgent and emergency care standards. https://www.england.nhs.uk/wp-content/uploads/2021/05/B0546-clinically-led-review-of-urgent-and-emergency-care-standards.pdf
- Nuffield Trust. A&E waiting times. https://www.nuffieldtrust.org.uk/resource/a-e-waiting-times#background
- Kings Fund. What’s going on with A&E waiting times?. https://www.kingsfund.org.uk/projects/urgent-emergency-care/urgent-and-emergency-care-mythbusters
- Royal College of Emergency Medicine. Crowding in Emergency Departments, https://www.cambridgeshireandpeterboroughccg.nhs.uk/easysiteweb/getresource.axd?assetid=3743&type=0&servicetype=1
- Sun BC, Hsia RY, Weiss RE et al. Effect of Emergency Department crowding on outcomes of admitted patients. Ann Emerg Med 2013; 61(6):605-611.
- Johnson KD, Winkelman C. The effect of Emergency Department crowding on patient outcomes: a literature review. Adv Emerg Nurs J 2011; 33(1):39-54.
- Royal College of Physicians. Focus on physicians: census of consultant physicians and higher specialty trainees 2018. 2019. https://www.rcplondon.ac.uk/file/14100/download
- Imo UO. Burnout and psychiatric morbidity among doctors in the UK: a systematic literature review of prevalence and associated factors. BJPsych Bull2017;41:197-204. doi:10.1192/pb.bp.116.054247. https://www.cambridge.org/core/journals/bjpsych-bulletin/article/burnout-and-psychiatric-morbidity-among-doctors-in-the-uk-a-systematic-literature-review-of-prevalence-and-associated-factors/08E4992134A26D418F6526FE5728BC65. pmid:28811913
- BMA. The impact of punitive pension taxation rules on doctors and the delivery of NHS services. https://www.bma.org.uk/media/2002/bma-briefing-on-the-impact-of-pension-taxation-jan-2020.pdf
- Kings Fund. NHS hospital bed numbers: past, present, future. https://www.kingsfund.org.uk/publications/nhs-hospital-bed-numbers
- The Audit Commission. Delivering sustainable cost improvement programmes. https://assets.publishing.service.gov.uk/government/uploads/system/uploads/attachment_data/file/285845/CIP_final_18_Jan_v2_0.pdf
- Nursing Notes. Figures reveal “sharp rise“ in nurses and midwifes quitting the profession. https://nursingnotes.co.uk/news/figures-reveal-sharp-rise-in-nurses-and-midwives-quitting-the-profession/
- Nursing and Midwife Council. Leavers’ Survey 2022. https://www.nmc.org.uk/globalassets/sitedocuments/data-reports/march-2022/leavers-survey-2022.pdf
- Royal College of Nursing. Raising and Escalating Concerns. https://www.rcn.org.uk/Professional-Development/publications/rcn-raising-and-escalating-concerns-uk-pub-009425
- NHS England. Covid-19 situation report. https://www.england.nhs.uk/statistics/statistical-work-areas/covid-19-hospital-activity/
- NHS Improvement. Model Hospital. https://model.nhs.uk, password required
- NHS Digital. General Practice Workforce Statistics. https://digital.nhs.uk/data-and-information/publications/statistical/general-and-personal-medical-services/31-may-2022
- BMA. Pressure in general practice data analysis. https://www.bma.org.uk/advice-and-support/nhs-delivery-and-workforce/pressures/pressures-in-general-practice-data-analysis
- Bendau, A., Petzold, M.B., Pyrkosch, L. et al. Associations between COVID-19 related media consumption and symptoms of anxiety, depression and COVID-19 related fear in the general population in Germany. Eur Arch Psychiatry Clin Neurosci 271, 283–291 (2021). https://doi.org/10.1007/s00406-020-01171-6
- Anxiety UK. Most common presented Anxiety Conditions Anxiety UK. https://www.anxietyuk.org.uk/wp-content/uploads/2021/11/Key-Facts-and-Figures-2020.pdf
- Johnson, L., Cornish, R., Boyd, A. et al. Socio-demographic patterns in hospital admissions and accident and emergency attendances among young people using linkage to NHS Hospital Episode Statistics: results from the Avon Longitudinal Study of Parents and Children. BMC Health Serv Res 19, 134 (2019). https://doi.org/10.1186/s12913-019-3922-7
- NHS England. Integrated Urgent Care England Aggregated Data Collection. https://www.england.nhs.uk/statistics/wp-content/uploads/sites/2/2022/05/Statistical-Note-IUCADC-March-2022.pdf
- James, A., Royal College of Psychiatry. Cost-of-living crisis threat of “pandemic proportions” to mental health, warns UK’s leading psychiatrist. https://www.rcpsych.ac.uk/news-and-features/latest-news/detail/2022/06/20/cost-of-living-crisis-threat-of-pandemic-proportions-to-mental-health-warns-uk-s-leading-psychiatrist
- NHS Digital, Mental Health Services Monthly Statistics Final March, Provisional Aprils 2022, https://digital.nhs.uk/data-and-information/publications/statistical/mental-health-services-monthly-statistics/final-march-provisional-april-2022
- BMA, NHS Backlog data analysis, https://www.bma.org.uk/advice-and-support/nhs-delivery-and-workforce/pressures/nhs-backlog-data-analysis
- Nuffield trust. What is the NHS sickness absence rate compared to the public sector average?. https://www.nuffieldtrust.org.uk/chart/sickness-absence-rates
- Imperial. Safer patient flow. https://www.imperial.nhs.uk/-/media/website/images/posters/get-winter-ready-materials/get-winter-ready-safer-factsheet-for-trust-staff.pdf?rev=2d0049074340447b93de85f829c6f1ff&sc_lang=en
- The Academy of fabulous stuff. https://fabnhsstuff.net/fab-stuff/the-focus-model-a-set-of-guiding-principles-to-help-teams-standardise-operational-site-management